The performance of each of its holdings varied widely since the fund’s inception in 2013. Volatility is too high given that on average, each holding returns only 3.97% p.a. Diversification remains key given that the spread between losers and winners remain wide (-51.58% to 75.25%),
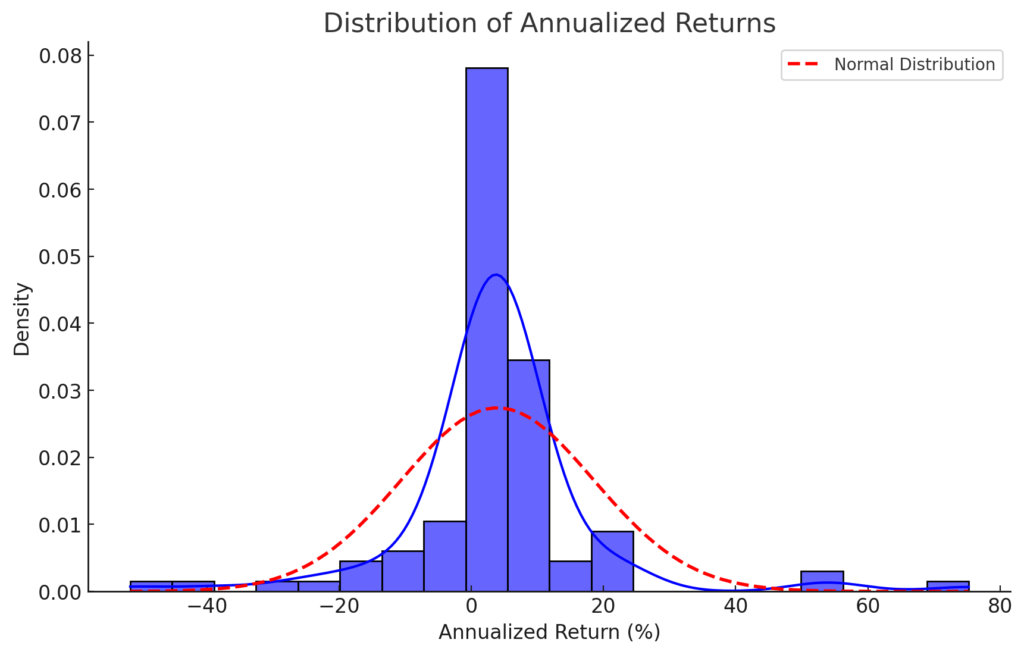
Key Statistics of Annualized Total Returns:
- Mean (Average) Return: 3.97%
- Median Return: 3.71%
- Standard Deviation: 14.57%
- Skewness: 0.94 (positively skewed, meaning more extreme positive returns)
- Kurtosis: 8.71 (leptokurtic distribution, indicating fat tails and frequent extreme values)
- Minimum Return: -51.58%
- Maximum Return: 75.25%
- 25th Percentile (Q1): 0.92%
- 50th Percentile (Median/Q2): 3.71%
- 75th Percentile (Q3): 7.05%
Analysis:
- The average return is positive (3.97%), but the high standard deviation (14.57%) suggests significant variability in returns.
- Positive skewness (0.94) indicates a tendency for higher extreme returns compared to negative ones.
- High kurtosis (8.71) means the distribution has heavy tails, implying a higher likelihood of extreme positive and negative returns.
- The wide range (-51.58% to 75.25%) shows that some assets experienced severe losses while others had exceptional gains.